Export Data to ForecastX
You can export sales or consumption data for a selected date range to an Excel spreadsheet, then use the ForecastX add-in to generate a forecast from that data.
Note
To use the ForecastX Connector app, you must have a full ForecastX license (not a Lite license) and install it as an add-in in Excel. See John Galt ForecastX for information on purchasing the software.
Choose the
 icon, enter Export to Excel (ForecastX), then choose the related link.
On the Export to Excel (ForecastX) page, populate the following fields:
Field Description Forecast Type Select the type of data to export to the Excel spreadsheet. Consumption: Export data about consumed components. The data is from the Item Ledger Entry page and the Legacy - Item Ledger Entry page for records with a Consumption entry type.
Sale: Export sales data. The data is from the Item Ledger Entry page and the Legacy - Item Ledger Entry page for records with a Sale entry type.
From Date Select the date from which to export data. To Date Select the date to which to export data. Item Heading If applicable, select a value to filter which items should be exported to the Excel spreadsheet. If a filter isn't added, then all of the items for the forecast type and in the date range will be included. Select Download.
Data from the Item Ledger Entry page and the Legacy - Item Ledger Entry page are exported to an Excel file for the entered date range.
Open the Excel file.
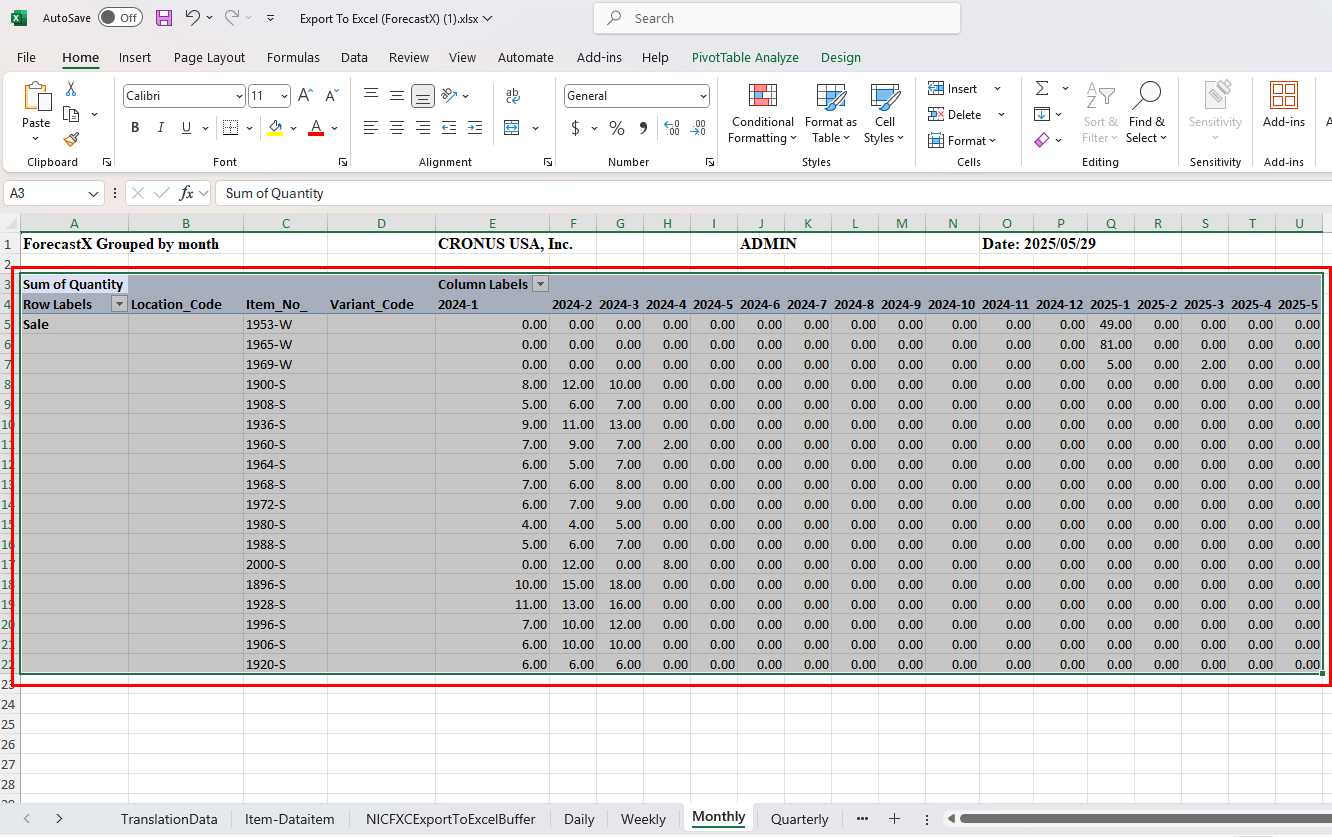
The Excel spreadsheet includes several tabs. Data from the Daily, Weekly, Monthly, Quarterly, and Yearly tabs can be exported to ForecastX.
Note
For ForecastX to read the data correctly, the cells below the dates cannot be blank. As a result, the cells are filled with a 0.00 value.
In the Excel spreadsheet, go to the Daily, Weekly, Monthly, Quarterly or Yearly tab depending on time frame you want to use for your forecast.
Important
If you do not follow the export steps, you will not be able to import the forecast back into Business Central.
Select all of the data in the table including the column headings.
Tip
To select the whole table, select a cell in the table, and press <Ctrl+A>.
Select Add-ins > Forecast to use ForecastX to generate the forecast.
In the ForecastX pop-up, on the Data Capture tab, populate the following fields:
Field Description Data is Organized In Select Rows. Contains Dates Select the checkbox. Periodicity Select the value that corresponds to the tab you are on. For example, if you are on the Monthly tab, select Monthly. Labels Enter 4.
This value represents the four columns: Row Labels, Location_Code, Item_No and Variant_Code.The rest of the ForecastX fields can be set up based on your forecasting requirements.
Select the Finish button.
A new Excel file is opened with the calculated forecast.
If desired, in the forecast Excel file, select a value in the drop-down to see the graphical results.
If desired, you can adjust the forecast values by entering values in the Actual lines.
If you enter data on the Actual lines, you must populate all of the Actual lines because when you import the data back into Business Central, you can only choose from either the calculated Forecast values or the Actual values.
When you are ready, you can import the forecast into Business Central.